Essential Metrics to Drive Customer Success in Product-Led Growth
Top Metrics to Measure Customer Success in a Product-Led Growth (PLG) World
The evolution of go-to-market (GTM) strategies in the SaaS industry has transformed how companies acquire, retain, and expand their customer base. One such approach, Product-Led Growth (PLG), has taken center stage in recent years. In a PLG model, the product itself becomes the primary driver of customer acquisition, retention, and revenue expansion, offering users direct value through hands-on experience rather than traditional sales-led methods.
PLG is gaining prominence due to its efficiency and scalability, as it leverages a seamless user experience to convert users into paying customers. Businesses like Slack, Dropbox, and Snowflake are excellent examples of companies that have successfully implemented PLG strategies to achieve exponential growth. However, while PLG is powerful, it’s not the only GTM strategy available. Sales-led and hybrid approaches remain relevant, especially for enterprise-focused solutions where high-touch interactions and consultative selling are crucial.
This article explores the critical metrics that Customer Success (CS) teams in a PLG model must track to drive user satisfaction, minimize churn, and enable growth. These metrics go beyond traditional customer satisfaction scores, focusing instead on product engagement, user adoption, and revenue growth opportunities.
1. Understanding the Role of Customer Success in a PLG World
Why CS Matters in PLG
In a PLG-driven business, the product experience is paramount. Customers often self-serve, navigating through the product on their own to discover value. The success of this self-directed journey hinges on a seamless product experience, but challenges like onboarding friction, lack of engagement, or unmet needs can derail users before they realize the product's full potential.
Customer Success teams play a crucial role by proactively engaging with users to ensure they find value quickly and consistently. Their responsibilities in PLG include:
- Guiding users during onboarding to reduce friction.
- Ensuring that users adopt and engage with the product’s core features.
- Identifying opportunities for account expansion, such as upgrades or add-ons.
The Shift in Metrics
In traditional sales-led models, metrics like Customer Satisfaction Score (CSAT) or Net Promoter Score (NPS) were sufficient to measure success. In a PLG model, however, these are no longer enough. Metrics now emphasize:
- Engagement: How frequently and effectively users interact with the product.
- Adoption: How well users are leveraging core features to achieve value.
- Expansion: The extent to which users upgrade or add features to their accounts.
This shift reflects the customer-centric, usage-driven nature of PLG, where user satisfaction is measured by their success with the product rather than their interactions with the sales or support teams.
2. The Top Metrics to Measure Customer Success in PLG
Net Revenue Retention (NRR)
Net Revenue Retention (NRR) is the percentage of recurring revenue retained from existing customers, factoring in upgrades, downgrades, and churn. It is a critical metric in a PLG model, where growth often relies more on expanding existing accounts than acquiring new ones.
Why It Matters:
- High NRR indicates strong product stickiness and value delivery.
- It reflects customer satisfaction, as users are willing to spend more on a product they find indispensable.
- Expansion revenue is a hallmark of successful PLG strategies, making NRR a key indicator of growth potential.
Example: Snowflake achieved an astounding 178% NRR by focusing on continuous product improvement and upselling to satisfied customers. Their proactive Customer Success strategy was integral to maintaining this metric as they scaled. (Source)
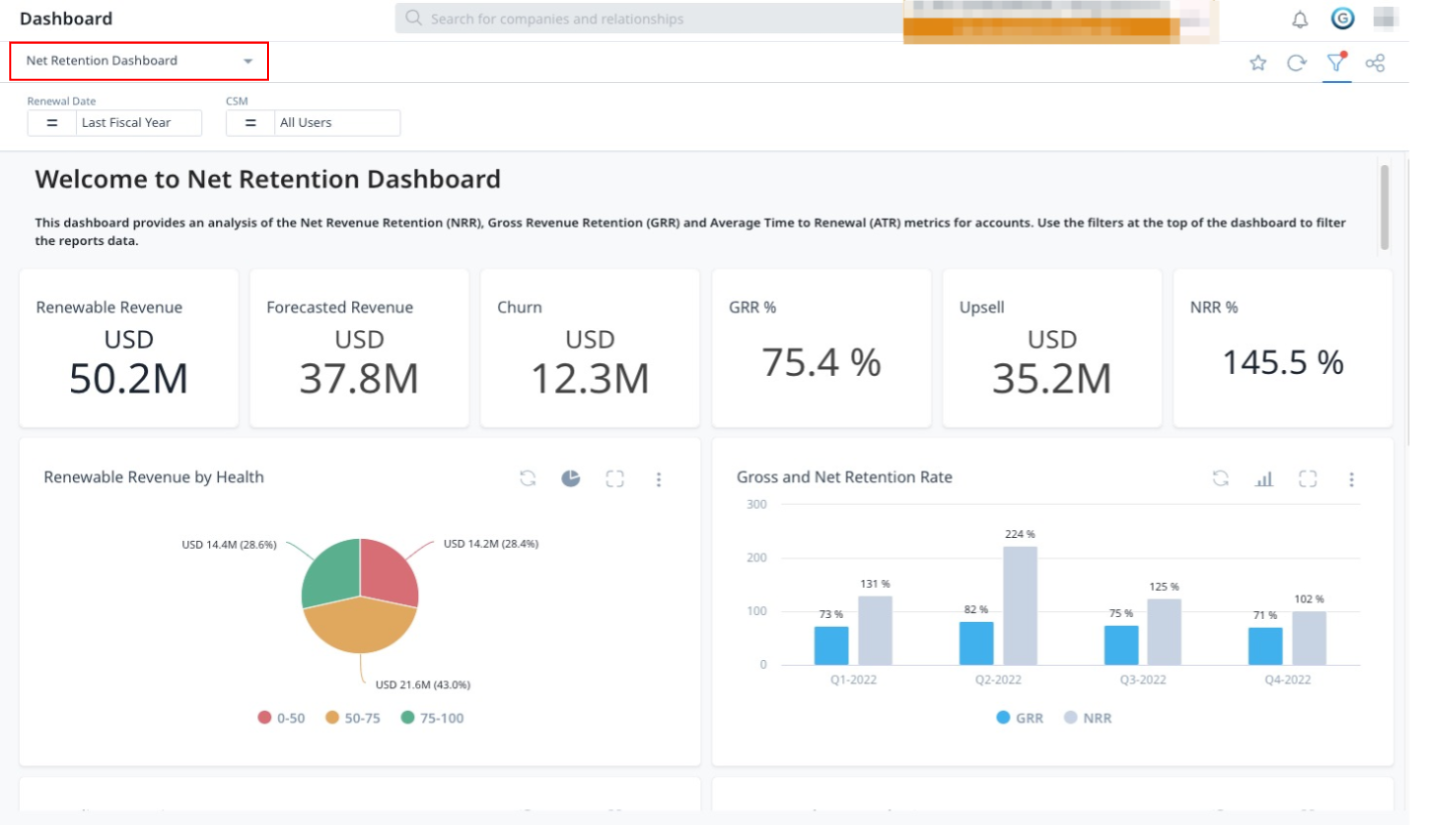
An example of an NRR dashboard (Source: Gainsight)
Product Adoption Rate
The Product Adoption Rate measures the percentage of users actively engaging with a product’s core features. This metric highlights how well users understand and utilize the product to achieve their goals.
Why It Matters:
- Tracks how effectively users are onboarded and engaged.
- Identifies bottlenecks or areas of friction in the customer journey.
- Signals potential risks, such as churn, if adoption rates are low.
Example: Groove reduced churn by focusing on adoption during the first 30 days. By analyzing user behavior, they identified engagement patterns that signaled future churn and intervened proactively. This approach reduced churn by 71%. (Source)
Time-to-Value (TTV)
Time-to-Value (TTV) measures how quickly users achieve their first “aha moment” with the product, where they realize its core value. For readers unfamiliar with this concept, this guide from Vitally provides an excellent overview of TTV, its importance, and how it is calculated.
In a PLG model, short TTV is critical, as users expect immediate results. Delays in reaching value can lead to frustration and disengagement.
Why It Matters:
- Shorter TTV increases user satisfaction and retention.
- Reduces churn by ensuring users experience value before disengaging.
- Directly impacts NRR, as faster value realization leads to stronger product adoption.
Effective onboarding and customer education are vital to reducing TTV and ensuring a positive user experience.
Customer Health Score (CHS)
Customer Health Score (CHS) combines metrics like product usage, customer feedback, and support interactions to assess the likelihood of churn or growth.
Example: Heap achieved 95% accuracy in renewal predictions by refining its health score model. By integrating data from Heap, Salesforce, and Catalyst, their CS team automated risk assessments and enabled efficient prioritization. (Source)
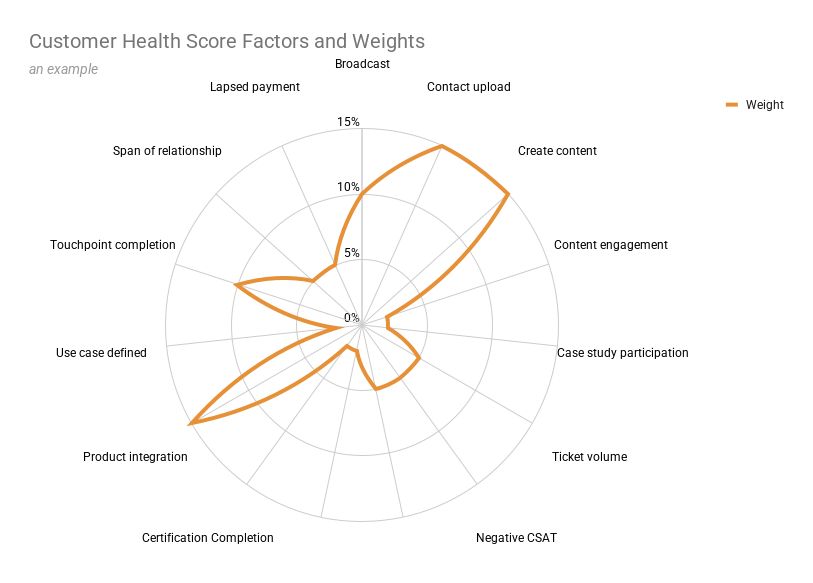
An example of factors and weights in a CHS (Based on this post from CSC)
Monthly Active Users (MAU) / Weekly Active Users (WAU)
MAU and WAU track the number of unique users engaging with the product over a defined time frame. These metrics highlight engagement and product stickiness, key indicators of long-term success in PLG.
Why It Matters:
- Provides insights into overall product usage trends.
- Helps identify active versus inactive users for targeted interventions.
- Indicates product relevance and potential growth opportunities.
Expansion Revenue Rate
Expansion Revenue Rate measures the percentage of revenue growth from existing customers via upgrades, add-ons, or cross-sells. In the PLG model, where customer growth is central, expansion revenue is a key driver of sustainable success.
Why It Matters:
- Shows customers’ willingness to invest more in the product.
- Highlights the effectiveness of upsell strategies and product expansions.
- Directly impacts Net Revenue Retention (NRR), a critical PLG metric.
Example: Slack strategically nurtures free-tier users by demonstrating premium value. Their approach drives paid upgrades, contributing to consistent expansion revenue growth.
Churn Rate
Churn Rate refers to the percentage of customers who cancel their subscriptions within a given timeframe. It’s a direct indicator of dissatisfaction, unmet needs, or lack of engagement.
Why It Matters:
- Highlights areas where customers are disengaging or dissatisfied.
- Directly impacts revenue growth and overall customer satisfaction.
- Helps refine onboarding and engagement strategies to reduce churn.
Example: Groove reduced churn by 71% through proactive interventions targeting at-risk users during their initial engagement phase. (Source)
3. How to Track and Use These Metrics
Data Integration and Tools
To effectively track PLG metrics, teams need robust data integration. Tools like Gainsight, Totango, and Catalyst provide comprehensive customer success tracking, while analytics platforms like Mixpanel or Amplitude monitor user behavior.
Recommended Steps:
- Centralize data from different tools for holistic insights.
- Use automation to surface actionable trends and reduce manual effort.
- Invest in training for teams to interpret and act on metric dashboards.
Cross-Functional Collaboration
Successful PLG strategies require collaboration across teams. Customer Success, Product, and Revenue Operations must align their efforts to optimize the customer journey and drive growth.
Examples of Collaboration:
- Improving TTV: Product teams streamline onboarding while CS teams provide hands-on guidance.
- Boosting NRR: RevOps identifies upsell opportunities while CS builds trust with customers.
Iterative Improvements
Metrics are not static—they evolve alongside customer needs and business goals. Teams must continuously analyze and refine their approaches to ensure metrics reflect true customer success.
Steps for Iteration:
- Analyze: Identify bottlenecks or inefficiencies in the customer journey.
- Test: Run experiments to determine effective solutions.
- Refine: Implement changes and monitor their impact on key metrics.
4. Real-World Examples of Metrics in Action
Case Study: Reducing Churn with CHS
Heap achieved a 95% renewal accuracy rate by integrating data from Catalyst and Salesforce. Their enhanced Customer Health Score helped prioritize at-risk accounts and strengthen renewal outcomes. (Source)
Case Study: Boosting NRR
Snowflake’s 178% Net Revenue Retention highlights their strategic focus on customer value and upsell opportunities. They consistently demonstrate product relevance, driving organic account expansion. (Source)
Case Study: Shortening TTV
Groove cut churn by 71% by targeting users who struggled during onboarding. Personalized assistance and clear product guidance helped users experience value faster. (Source)
5. Lessons from Successful PLG Companies
Slack: Engagement and Expansion
Slack drives engagement by leveraging a freemium model and encouraging organic team adoption. Their consistent focus on user experience results in high conversion rates.
Dropbox: Simplicity and Viral Growth
Dropbox excels at viral growth, combining intuitive usability with referral-based incentives. This approach amplifies their reach while retaining active users.
Notion: Fostering Community
Notion leverages community-generated templates and collaboration features to drive engagement. Their grassroots advocacy strategy has propelled user loyalty.
FAQs
1. What is Product-Led Growth (PLG)?
PLG is a go-to-market strategy where the product itself drives customer acquisition, retention, and expansion through a seamless user experience.
2. How do I improve my Customer Health Score?
Use integrated tools to monitor user activity, feedback, and support tickets. Tailor proactive support and product interventions based on health score data.
3. Why is NRR critical in PLG models?
NRR reflects revenue retention and growth from existing customers, highlighting the product’s stickiness and the success of upsell strategies.
4. How does Time-to-Value impact retention?
A shorter TTV ensures users see value quickly, reducing the risk of churn and fostering long-term engagement with the product.
5. What tools can track PLG metrics effectively?
Tools like Gainsight, Totango, Mixpanel, and Catalyst are excellent for tracking key metrics like NRR, CHS, and adoption rates.